The techno-economic ecosystem of next generation virtual worlds
Publication date: October 25, 2023
Something about DGTES

The rapid advancements in digital technology are accelerating the process of digital transformation, not only within the traditional information and communication technology (ICT) sector but across all industrial ecosystems. This is fundamentally reshaping the global landscape of technological, social, and economic progress and presenting numerous challenges to the EU’s competitive standing. Achieving and bolstering digital leadership has now become a pivotal driver for the EU’s competitiveness, as well as a prerequisite for successfully navigating the twin transitions and ensuring future prosperity within the EU. Consequently, the mastery of essential and emerging digital technologies is deemed vital for the EU to maintain its strategic independence.
Another challenge that arises is the necessity for updated metrics capable of accurately measuring the swift advancements in digital technologies and the widespread nature of digital transformation. To address this issue, the JRC (to see the website of the European Commission’s Joint Research Centre please press the link) has developed the Techno-Economic ecoSystems (TES) methodology, which provides a framework for comprehensively mapping and analyzing intricate and rapidly evolving ecosystems driven by technology. Joint Research Centre (JRC) is to support EU policies with independent evidence throughout the whole policy cycle. The JRC is located in 5 Member States (Belgium, Germany, Italy, the Netherlands and Spain). The Digital Economy Unit of the JRC Directorate Growth and Innovation provides quantitative and qualitative techno-socioeconomic research targeting the impacts of Digital Transformation on the economy and society. It aims to provide an independent assessment of key opportunities and challenges for Europe arising from new digital technologies and of the measures that could be taken to shape future outcomes to the benefit of European society.
The TES (Techno-Economic ecoSystems) approach is versatile and can be applied to various ecosystems. It has already been utilized in examining several techno-economic sectors expected to have a significant impact on digital transformation, such as photonics, earth observation technologies, and artificial intelligence (AI), which are integral components of the EC AI Watch’s global landscape analysis.
DGTES (The Digital Techno-Economic ecoSystem) represents the comprehensive implementation of the TES methodology, with a forward-looking and policy-focused approach, specifically aimed at mapping the global digital ecosystem. DGTES generates a graph dataset that offers flexibility in examining crucial components of the worldwide digital ecosystem. These components include the actors involved, their activities, their geographical connections, technological aspects, financial aspects, structural characteristics, as well as the exploration of knowledge flows, gatekeepers, central nodes, latent communities, concealed patterns, and emerging clusters of excellence at various levels of detail.
Drawing from multiple micro-level databases encompassing business, innovation, and research endeavors (including projects funded by the EU), DGTES provides both aggregated data at the national and regional levels and detailed information about specific actors. This wealth of data enables the creation of a vast array of quantitative indicators, including network indicators that help identify vulnerabilities and interdependencies within the ecosystem.
DGTES provides quantitative indicators and metrics that are well-suited for charting the geographical spread, technological advancement, and progression of a multifaceted and ever-changing industrial ecosystem. It enables the generation of fresh perspectives and analyses that focus on several key aspects, including Europe’s competitive edge and leadership, strategic independence, and technological sovereignty. Additionally, it sheds light on knowledge dissemination, excellence within research networks, the emergence of regional technology clusters, innovation achievements, investments, and the advancement of technological and industrial capabilities.
Subdomain
The Digital Techno-Economic ecoSystem (DGTES) is a tool that maps and analyzes the global digital ecosystem using the analytical approach of Techno-Economic ecoSystems (TES). DGTES focuses on policy-relevant and forward-looking digital activities, excluding some of the more established ones in the digital domain. DGTES is highly flexible and can be zoomed in to examine specific digital subdomains.
In this case, the emphasis is on the next generation of virtual worlds, providing descriptions and insights into the activities and key actors shaping this subdomain. Within DGTES, subdomains are delineated based on activities related to business, innovation, and research, identified through a list of specific keywords. For the virtual worlds subdomain, a list of 215 keywords, such as “blockchain,” “AR” (augmented reality), and others, has been compiled. This list was created with the assistance of experts, bibliographic resources, and a systematic approach consistent with the TES methodology.
These keywords enable an exploration of the virtual worlds subdomain within the broader digital ecosystem, considering virtual worlds both as an independent ecosystem and as an intersection within the larger digital landscape. Once these activities are identified, the respective players or entities engaged in each activity can also be pinpointed.
Composition of the virtual worlds subdomain in the DGTES global digital ecosystem
Within the subdomain of virtual worlds, there are approximately 27,000 distinct activities, accounting for roughly 4% of all activities within the broader digital ecosystem, which encompasses over 600,000 activities in total. Among the 333,000 identified players or entities in the global digital ecosystem, nearly 15,600 are actively involved in activities related to virtual worlds, constituting approximately 5% of all players within the digital ecosystem.
When considering activities associated with EU-funded projects (including FP7, Horizon 2020, and Horizon Europe) and the corresponding players, these numbers expand to approximately 27,500 activities and around 18,000 players. This count includes players located not only within the EU but also those in non-EU countries who participate in projects related to virtual worlds funded by the EU.
When examining the breakdown of activities within the virtual worlds subdomain, it becomes evident that research and innovation (R&I) activities constitute nearly 80% of all activities. This percentage of R&I activities is higher than what is observed across the entire digital ecosystem, where it stands at 71%. Notably, the share of innovation activities within the virtual worlds domain surpasses that of the overall digital ecosystem (76% versus 66%), while the proportions of research and business activities are comparatively lower (2% versus 5% and 22% versus 29%, respectively). This pronounced emphasis on activities related to patents indicates an inherently “innovation-driven” character of the virtual worlds subdomain in comparison to the broader digital domains.
When analyzing the makeup of players within the virtual worlds subdomain, it becomes apparent that firms account for 86% of all players. Although they constitute the majority, this share is slightly smaller than what is observed across the entire digital ecosystem, where firms make up 94% of all players. The larger representation of research institutions and universities marks a notable difference in terms of player composition within the virtual worlds domain. These research-focused entities account for 13% of all players in the virtual worlds subdomain, which is significantly higher than the 5% they represent in the broader digital ecosystem. In contrast, government institutions play a marginal role, aligning with average figures.
Regarding the geographic distribution of players, the virtual worlds subdomain closely mirrors the geographical composition, and concentration, of the global digital ecosystem. Three major geographical areas, namely China, the United States, and the European Union, collectively host approximately 70% of all players. This proportion is consistent with the distribution of players in the overall digital ecosystem, where these three regions account for 65% of all players. Notably, the share of Chinese players is twice that of US players, and the number of US players is twice that of EU players.
However, it is noteworthy that the regional composition of players and the relative rankings of the three primary geographical areas (China, the US, and the EU) vary significantly depending on the type of activity.
- Innovation Activities (Patent Applications): China hosts nearly 60% of all players engaged in virtual worlds-related innovation activities (such as patent applications). South Korea follows with 16%, the US with 9%, and Japan with 4%.
- Business Activities: The distribution of players in business-related activities presents a different geographical pattern. In this case, the US leads with 34% of players, followed by the EU with 18%, and China with 12%.
- Research Activities: Research activities see the EU in the lead with 31% of players, trailed by the US with 17% and China with 13%. Additionally, other Asian and South Korean players also play relatively larger roles in research activities.
These variations underscore the different regional strengths and focuses in various types of virtual world-related activities, highlighting the dynamic nature of the digital landscape across regions.
Focus on EU27
As for the composition and characteristics of the virtual worlds subdomain within the European Union (EU), the analysis includes activities identified through EU-funded projects from FP7, Horizon 2020, and Horizon Europe, along with the corresponding players.
Within the EU27, there are approximately 3,700 players, constituting roughly 24% of all players within the virtual worlds subdomain. These players are engaged in about 2,500 activities, accounting for approximately 9.4% of all virtual worlds-related activities. Among these activities, 496 are associated with EU-funded projects, representing 20% of the activities within the EU virtual worlds subdomain.
It is worth noting that the share of activities linked to EU-funded projects in the virtual worlds subdomain is significantly larger compared to the share of EU-funded projects in the broader EU digital ecosystem, where it stands at 17%. Additionally, the EU virtual worlds subdomain exhibits a higher proportion of research activities (9%) in comparison to the global virtual worlds subdomain (2%). Moreover, business activities also have a relatively larger share in the European virtual worlds subdomain, accounting for 42%.
When examining the players within the EU virtual worlds subdomain, it becomes evident that this subdomain differs in player composition compared to the global virtual worlds subdomain.
- Firms: Firms represent 63% of players in the EU virtual worlds subdomain, which is a smaller share compared to the global virtual worlds subdomain.
- Research Institutions and Universities: In contrast, research institutions and universities account for a much larger share of players within the EU virtual worlds subdomain, comprising 29%. This is notably higher than their representation in the global virtual worlds subdomain.
- Government Institutions: Government institutions are also relatively more engaged in virtual worlds-related activities within the EU subdomain compared to their involvement in the entire digital ecosystem.
This player composition is consistent with the significant contribution of EU-funded projects to shaping the EU virtual worlds ecosystem. Notably, EU-funded projects involve 2,065 players, indicating that more than half (55%) of European players in the virtual worlds subdomain are participating in a virtual worlds-related EU-funded project.
When considering the number of players, including those involved in relevant EU-funded projects, the top positions in the EU virtual worlds subdomain are occupied by five countries: Germany, Spain, France, Italy, and the Netherlands. Collectively, these countries account for approximately 60% of players in the virtual worlds subdomain within the EU. Remarkably, these are the same countries that hold the top five positions when examining the number of players across the entire digital ecosystem. This underscores their prominent role in both the broader digital landscape and the virtual worlds subdomain within the EU.
The composition of the digital ecosystem is subject to variation from one country to another. A more in-depth analysis can provide valuable insights into the distinct country-level characteristics within the European virtual worlds subdomain. Additionally, given the significance of EU-funded projects in specific domains and areas of virtual worlds ecosystem development, it is advisable to concentrate on the analysis of collaborations among EU countries. This approach can offer a more comprehensive understanding of the dynamics and relationships within the virtual worlds ecosystem at both the national and EU levels.
Digital areas and sector composition in the virtual worlds subdomain
In the Digital Techno-Economic ecoSystem (DGTES), digital areas refer to coherent techno-economic categories employed to group digital technologies that pertain to the same technological domain. The DGTES digital ecosystem comprises a total of 15 digital areas or domains. Table 1 provides an overview of the “technological composition” of the virtual worlds subdomain, illustrating the connections between activities related to virtual worlds and eight specific digital domains. It comes as no surprise that the digital domain encompassing “extended reality, virtual reality, augmented reality, mixed reality, metaverse” hosts the majority of the identified activities, given its pivotal role in the virtual worlds subdomain.
| Extended reality, virtual reality, augmented reality, mixed reality, metaverse | 93.958% |
| Infrastructure, cloud computing, digital platforms, online platforms, IaaS, SaaS, Paas, social networks, internet | 2.314% |
| Internet of things, AIDC (automatic identification and data capture) | 1.164% |
| Artificial intelligence | 1.500% |
| Blockchain, distributed ledge | 0.907% |
| 5G and beyond, autonomous networks, communications, telecommunications and connectivity | 0.111% |
| Verticals | 0.043% |
| 3D printing, additive manufacturing | 0.004% |
Table 1. Activities by digital area in the virtual worlds subdomain
When examining the distribution of all types of players involved in the virtual worlds subdomain by economic sector (as shown in Table 2), it becomes evident that the majority of players, constituting 52%, originate from the ‘Information and Communication’ and ‘Manufacturing’ sectors. Furthermore, several other economic sectors house players engaged in virtual worlds-related activities, including:
- ‘Education’ and ‘Professional and Scientific Activities,’ each contributing approximately 10% of the player base.
- ‘Wholesale and Retail Trade’ with a 7% representation.
- ‘Administration’ with 5.5% involvement.
Exploring the specific activities within these sectors can provide valuable insights into the diverse applications of virtual worlds beyond the realm of Information and Communication Technology (ICT)-related fields.
| Sector | % |
| Information and communication | 42,33% |
| Manufacturing | 10,13% |
| Education | 9,91% |
| Professional, scientific and technical activities | 9,76% |
| Wholesale and retail trade, repair of motor vehicles and motorcycles | 7,14% |
| Administrative and support service activities | 5,52% |
| Financial and insurance activities | 3,40% |
| Public administration and defence, compulsory social security | 3,02% |
| Other service activities | 2,34% |
| Arts, entertainment and recreation | 2,15% |
| Human health and social work activities | 1,65% |
| Accommodation and food service activities | 0,97% |
| Transportation and storage | 0,59% |
| Agriculture, forestry and fishing | 0,34% |
| Construction | 0,28% |
| Real estate activities | 0,28% |
| Activities of households as employees | 0,06% |
| Mining | 0,06% |
| Water supply; sewerage, waste management and remediation activities | 0,06% |
Table 2. Players by sector in the virtual worlds subdomain (2009-2022).
Foreign ownership
The information contained in the DGTES graph database allows representing the virtual worlds subdomain as a web of ownership relations across companies located in different countries. From a worldwide perspective, the US is in first place (about 24%) per number of owned foreign companies that engage in virtual worlds related activities in the worldwide DGTES digital ecosystem, followed by France (7%), the UK (7%), Japan (7%) and Germany (8%). (figure 4)
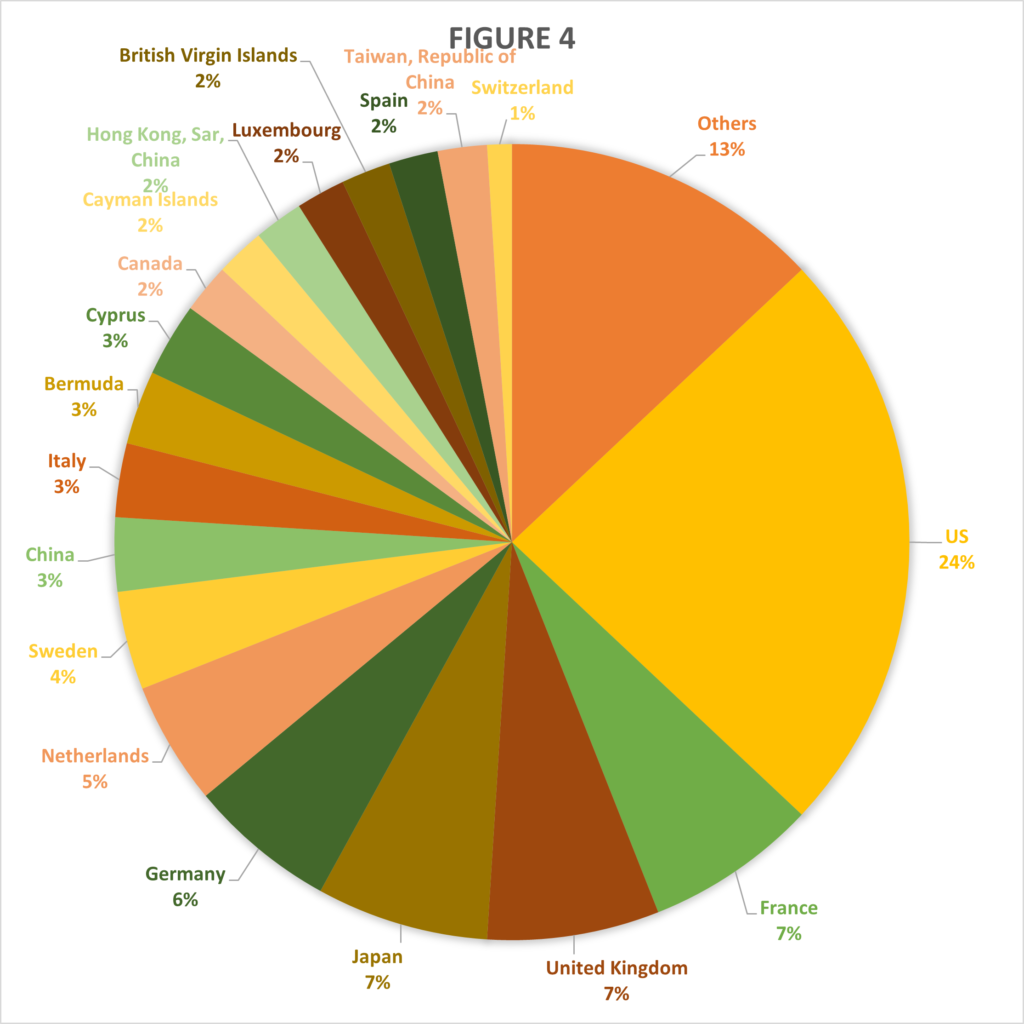
Figure 4. Foreign ownership of players in the virtual worlds subdomain, by owner’s country (2009- 2022).